One of the most crucial aspects of Spark is its executor/core architecture. Tuning Spark jobs often involves trial and error. Fudging numbers can often feel like magic unless you truly understand what’s happening under the hood.
This post walks through the internal constructs Spark uses to manage and allocate memory, and how those constructs map to real-world environments like AWS EMR.
Inside the JVM
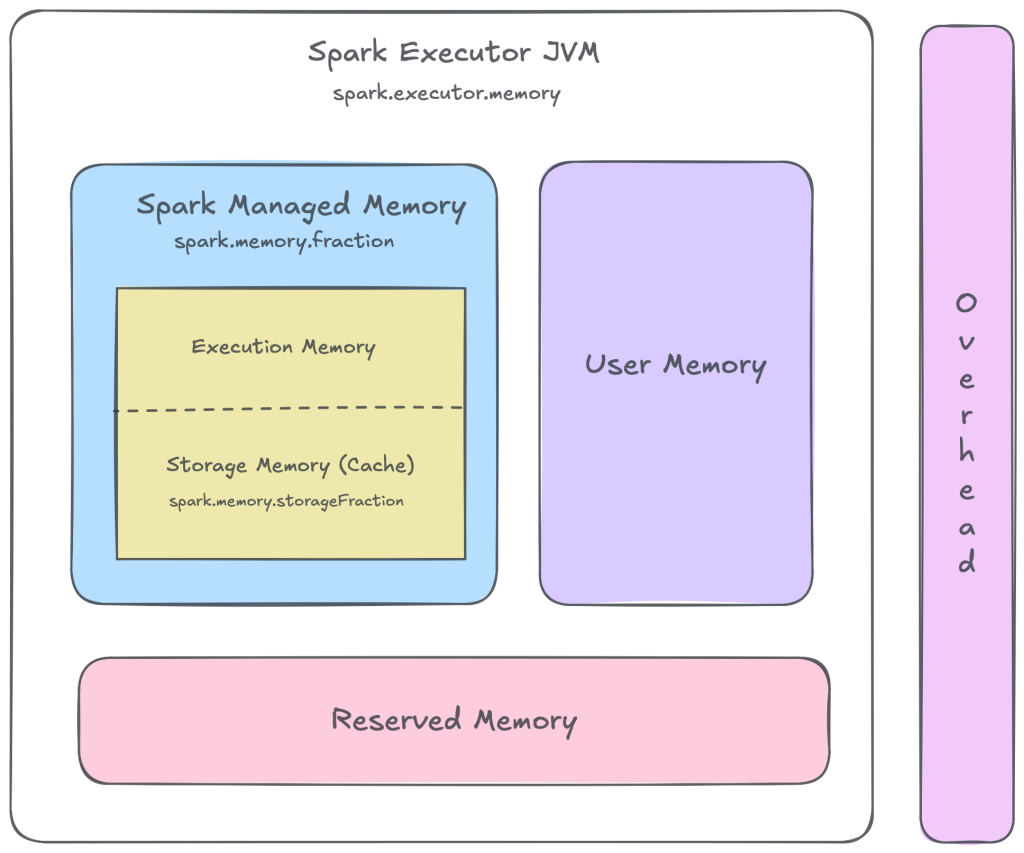
A Spark executor is allocated a fixed amount of memory (controlled by spark.executor.memory). This is the total heap memory available to Spark for all its computation and storage requirements. Functionally, Spark splits this memory into logical regions each serving a different purpose.
Reserved Memory
Before Spark allocates memory for processing, it reserves a small fixed portion of the executor heap for itself. This reserved memory (typically ~300 MB) is used for internal bookkeeping and metadata and is not available for execution or caching.
Unified Memory (Spark-Managed)
From the remaining heap, Spark allocates a portion for its core execution needs—this is known as Spark-managed (or unified) memory. This is controlled by spark.memory.fraction, which defaults to 0.6, meaning Spark intentionally limits itself to 60% of the usable heap.
Spark-managed memory serves two purposes:
- Execution memory: used for computation such as shuffles, joins, aggregations, and sorts.
- Storage memory: used to cache or persist datasets via .cache() or .persist().
The boundary between execution and storage is fluid. Storage memory can be reclaimed at any time to satisfy execution needs, since Spark prefers recomputing cached data over stalling job progress. This is often seen as cache evictions or spills to disk.
User Memory
The remainder of the executor heap is user (unmanaged) memory. This is where application-level objects live, including UDF state, user-defined data structures, deserialized objects, and other JVM allocations Spark does not control directly. By default, this accounts for the remaining ~40% of usable heap, indirectly determined by spark.memory.fraction.
The Container Layer (Memory Overhead)
In addition to the JVM heap, Spark allocates off-heap memory per executor to support components that do not live on the heap, such as native libraries, JVM thread stacks, network (Netty) buffers, and (for PySpark) Python worker processes. This is configured via spark.executor.memoryOverhead and defaults to ~10% of the executor heap, meaning a 16 GB executor typically requires an additional ~1.6 GB of memory beyond the heap to run safely.
Physical Mapping: The EC2 Instance
Executors ultimately run on physical hardware. A single EC2 instance (for example, 8 vCPUs and 256 GB RAM) is typically divided into multiple executors to balance parallelism, memory usage, and fault isolation.
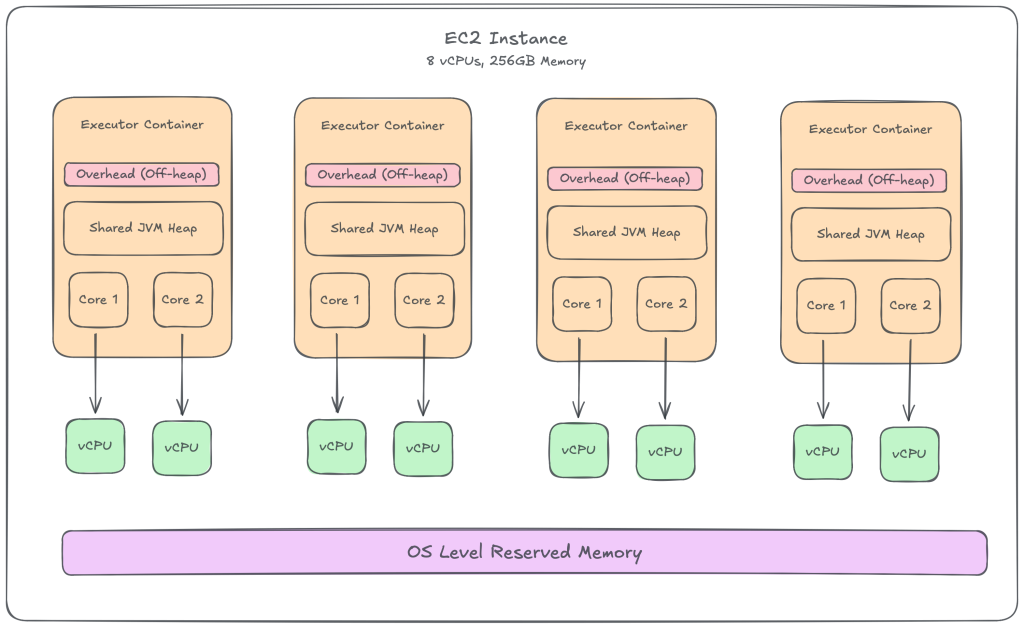
Each executor is assigned a fixed number of cores via spark.executor.cores which map directly to vCPU slots on the EC2 instance. For example, an 8-vCPU node might be split into four executors, each configured with 2 cores.
This physical mapping introduces two hard constraints:
- Memory Limits: The sum of executor heaps + overhead must fit within the node’s physical RAM, leaving a buffer for the Linux kernel and system daemons.
- CPU Limits: Assigning more executor cores than available vCPUs oversubscribes the CPU, leading to increased context switching and reduced performance. Ideally, each executor core should map 1:1 to a vCPU core.
Executor sizing is ultimately constrained by what fits on a single node, not the total capacity available on the cluster. This is where cluster managers like YARN and Kubernetes come in, acting as schedulers that assign these executor containers to the available physical nodes.
Concurrency and Contention
Because an executor is a single JVM, all memory—execution, storage, and user memory—is shared across its cores. Increasing spark.executor.cores increases the number of concurrent tasks contending for the same heap. Under higher concurrency, execution memory pressure rises, leading to more frequent cache eviction and elevated garbage collection (GC) overhead, often degrading performance instead of improving it.
Final Thoughts
Understanding executors and their relationship with the physical hardware explains many of Spark’s counterintuitive performance behaviors. Shuffles, skew, caching, and garbage collection become easier to reason about once the executor model is clear.